Analysis and Visualisation Software / BrainVoyager QX
BrainVoyager QX
BrainVoyager is the "all-in-one" solution for brain imaging research enables analysis and visualisation of functional and structural magnetic resonance imaging data.
- Highly flexible data processing on raw data
- Comprehensive set of analysis and visualization tools.
- Beautiful visualisations of obtained results.
- Used in more than 500 research groups worldwide, it is known for its high processing speed and interactive, user friendly interface.
- Cross Platform – use your preferred operating system and exploit existing hardware
- Fully open programming interface for advanced users
- Bidirectional connection with BESA (Brain Electrical Source Analysis) allows easy integration with EEG and MEG data.
Guide Price: £4650
SKU: N1600


BrainVoyager is designed for high performance, ease of use and flexible data processing. BrainVoyager offers a comprehensive set of analysis and visualization tools which start their operation on raw data (2D structural and functional matrices) and produce beautiful visualizations of the obtained results.
Project Creation
BrainVoyager starts by automatically assembling images into 2D and 3D functional and anatomical multi-slice projects.
Diffusor Tension Imaging (DTI) module to analyze diffusion-weighted MRI data including calculation of FA maps, fiber tracking and FA group comparisons.
 Data Analysis
Data analysis includes preprocessing, correlation analysis, determination of Talairach coordinates, volume rendering, surface rendering and cortex flattening.
Preprocessing
Preprocessing includes motion correction, Gaussian spatial and temporal data smoothing, linear trend removal and filtering in the frequency domain.
Statistical Analysis
BrainVoyager performs a wide range of statistical analyses including; parametrical mapping, contribution maps, Independent Component Analysis (ICA), Region-of-interest analysis and Event-related fMRI analysis. specifications.
Analysis tools, modules and plugins
- ANCOVA module: allows import and analyses of multi-subject data sets.
- Self-Organizing Group ICA Plugin: allows group level ICA by analyzing the spatial similarity of independent components across subjects.
- Group Data Simulator Plugin: creates multi-subject data sets allowing to test new analysis tools as well as to learn how to analyze planned fMRI experiments.
- Fuzzy Clustering of Time Courses Plugin: allows clustering voxels of VTC data sets with respect to the similarity of their time courses.
- Group-level cortical thickness analysis (CTA): can now be performed using cortically aligned brains.
- Granger Causality Mapping: to estimate influences between brain areas
- Multiple Comparison Correction: using a cluster-size threshold
- BOLD Latency Mapping
Visualization Tools
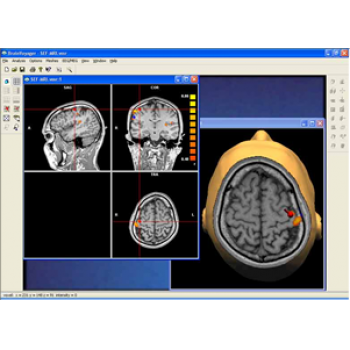
Parametric and non-parametric statistical maps may be superimposed both on the original functional scans as well as onto T1-weighted 2D or 3D anatomical reference scans. Time courses of selected regions-of-interest (ROIs) are available both in 2D and 3D representations. Statistical maps may be computed either in the 2D or 3D representation since structural as well as functional 4D data (space x time) are transformed into Talairach space. This allows you to compare activated brain regions across different experiments and across different subjects
Segmentation
Segmentation of tissue (e.g., isolating the brain, differentiating gray and white matter) is performed using region-growing methods, filter operations as well as the application of 3D templates. Using the mouse it is very easy to explore a 3D volume with superimposed pseudocolor-coded statistical maps in a four-window representation showing a sagittal, coronal, transversal and oblique section. Based on a (segmented) 3D data set a three-dimensional reconstruction of the subjects' head and brain can be calculated and displayed from any specified viewpoint using volume or surface rendering.
Advanced segmentation tool means even higher quality segmentation of grey and white matter and boundaries.
Volume Rendering
Volume rendering is performed with a very fast ray casting algorithm; lightning calculations are based on Phong-shading. Surface rendering of reconstructed surfaces is performed using OpenGL. Using texture mapping, a reconstructed surface (e.g., head or brain) may be sliced in real time, showing both surface and volume data at the same time. Initial polygon meshes serve as the basis for surface finding, cortex inflation and cortex flattening computations.
Talairach Tools
Talairach transformation is performed in two steps. The first step consists of rotating the 3D data set for each subject to be aligned with the stereotaxic axes. For this step the location of the anterior commissure (AC) and the posterior commissure (PC) as well as two rotation parameters for midsagittal alignment has to be specified interactively. In the second step the extreme points of the cerebrum are specified. These points together with the AC and PC coordinates are then used to scale the 3D data sets into the dimensions of the standard brain of the Talairach and Tournaux atlas.
Surface Reconstruction
The surface reconstruction procedure starts with a sphere (recursively tesselated icosahedron) or a rectangle, which slowly wraps around a (segmented) volume data set. In order to avoid topological defects and to let the surface smoothly grow into deep sulci, a dynamic mesh algorithm was developed which automatically invents new polygons on the fly at places where they are needed. A reconstructed cortical surface may be inflated, cut interactively and slowly unfolded minimizing areal distortions. Statistical 3D maps may be superimposed on reconstructed, inflated or flattened cortex. Signal time courses may be invoked by simply pointing to any region of a visualized surface.
Mesh Manipulation
Fast and interactive surface slicing, cortex inflation and unfolding in real-time.
Display Utlities
Visualization consists of color-coded displays, point models, wire frames, shaded surfaces, transparent rendering, scene animation. Scene viewing conditions can be saved and loaded and 2D/3D images can be exported, movie files, meshes etc.
UPDATE! The "NIfTI-1 Converter Plugin", implemented by Hester Breman, allows to exchange data with other fMRI software packages.
 Coregistration of MRI with EEG & MEG
For an easy superposition of the results of source analysis with individual EEG and MEG data, BrainVoyager provides an interactive link to BESA (Brain Electrical Source Analysis). The bidirectional connection of the two programs allows for source seeding from fMRI clusters with one mouse click.